

Library Health Dashboard
In the Altium workspace, you can see which (and how many) components you currently have at your disposal, and you can also view a summary of the health of those components. You can also access more detailed information regarding component health through a dedicated Library Health dashboard. This provides greater detail about issues and enables you to quickly assess and fix components accordingly.
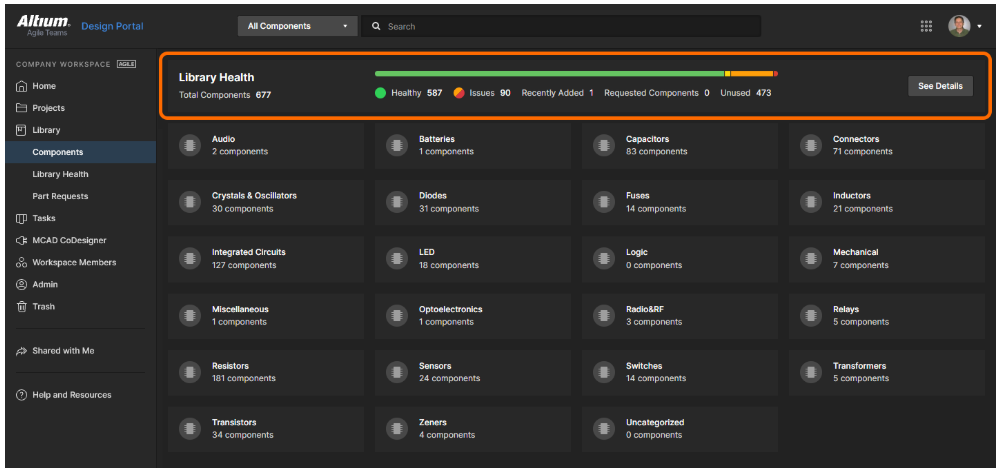
Access your managed components through the "Components" page of the Workspace's browser interface.
A summary of the overall health of your workspace components appears in the top region of the Components page.
Tip: The summary becomes populated once an initial component health check is performed. This check is performed automatically the first time the Components page is accessed.
The following information is also presented under Components:
- The total number of components in your workspace. This is the sum of the ‘healthy’ components plus those with an issue (error).
- The number of healthy components.
- The number of components that have an issue. A particular component can have multiple issues.
- The number of components that have been recently added to the workspace. For example, if two components were created yesterday and three more were added today, the number reflected on the dashboard will be 3 (three).
- The number of requested components – as part of the "Part Requests" feature (available with the Pro Subscription Plan).
- The number of unused components. Components not used in a managed schematic sheet or directly within a design.
The health indicator bar visually shows you the health of your components. It reflects healthy components in green and those with an issue in other colors – warnings in yellow, fatal errors in red, or errors in orange.
Click the ![]() button to access the detailed Library Health dashboard page. The top of the page presents the same summary information found at the top of the main Components page of the interface. Below are the supported health check analyses gathered into different subjects.
button to access the detailed Library Health dashboard page. The top of the page presents the same summary information found at the top of the main Components page of the interface. Below are the supported health check analyses gathered into different subjects.
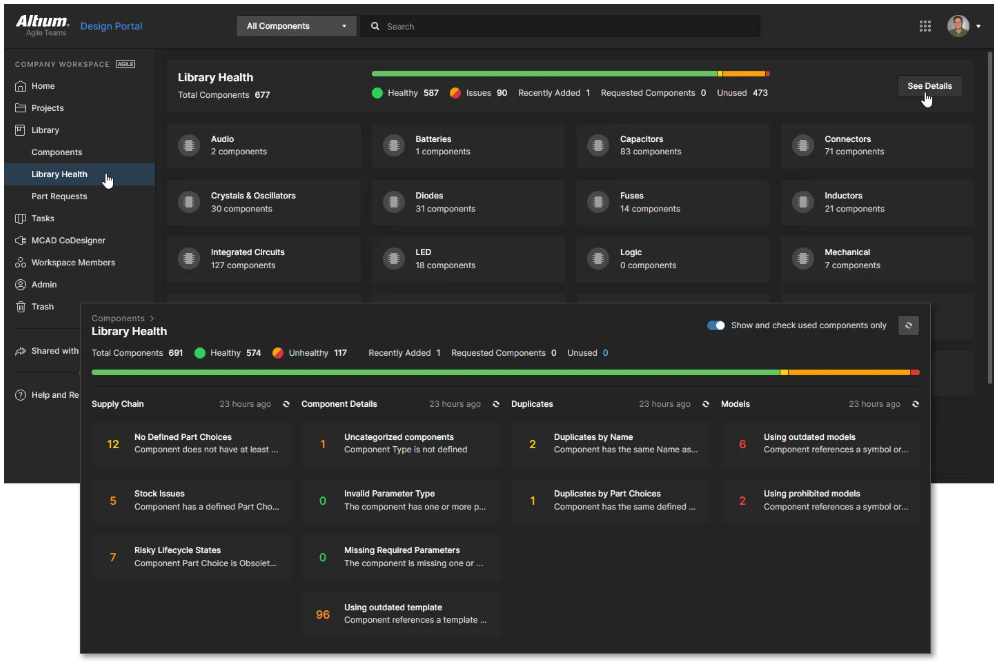
Enable the “Show and check used components only” option on the top right of the dashboard to only present health checking data for components you are using in your designs or managed schematic sheets. Health checking is performed when the dashboard is refreshed, and all unused components will be excluded from checking.

The following issue themes are split into columns, and health check analyses are currently supported:
Supply Chain
- No Defined Part Choices – a component fails this health check if it does not have at least one Part Choice defined and has no link to a Manufacturer Part.
- Stock Issues* – a component fails this health check if it has a defined Part Choice that is not in stock.
- Risky Lifecycle States* – a component fails this health check if it has an obsolete Part Choice, is not recommended for new designs (NRFND), or is invalid. You may encounter challenges in purchasing and supplying your design components in these states.
- Predicted Supply Chain Issues – a component fails this health check if the Years To End Of Life (YTEOL) is less than 1 year. Less than 2 years of YTEOL is a warning. This issue theme is available when the SiliconExpert Integration is enabled for your company.
Component Details
- Uncategorized Components – a component fails this health check if its type is undefined.
- Ambiguous Component Parameters* – a component fails this health check if it has one or more parameters that do not comply with the latest version of the applicable component template.
- Missing Required Parameters – a component fails this check if it lacks the parameters required in the template.
- Using Outdated Template* – a component fails this health check if it references a component template that is not the latest revision.
Duplicates
- Duplicates by Name – a component fails this health check if it has the same name as another component.
- Duplicates by Part Choice – a component fails this health check if it has the same defined Part Choice as another component.
Models
- Using Outdated Models – a component fails this health check if it references an outdated symbol or footprint model.
- Using Prohibited Models* – a component fails this health check if it references a symbol or footprint model that is not for design use.
* Available with the Pro Subscription Plan.
Tip: Each health check analysis tile reflects the number of components that fail a health check. Color coding reflects healthy/no issues in green, fatal errors in red, errors in orange, and warnings in yellow.
Clicking on a health check analysis tile will provide a more detailed description of the check with steps to resolve (where available) and a detailed listing of all components failing that health check.
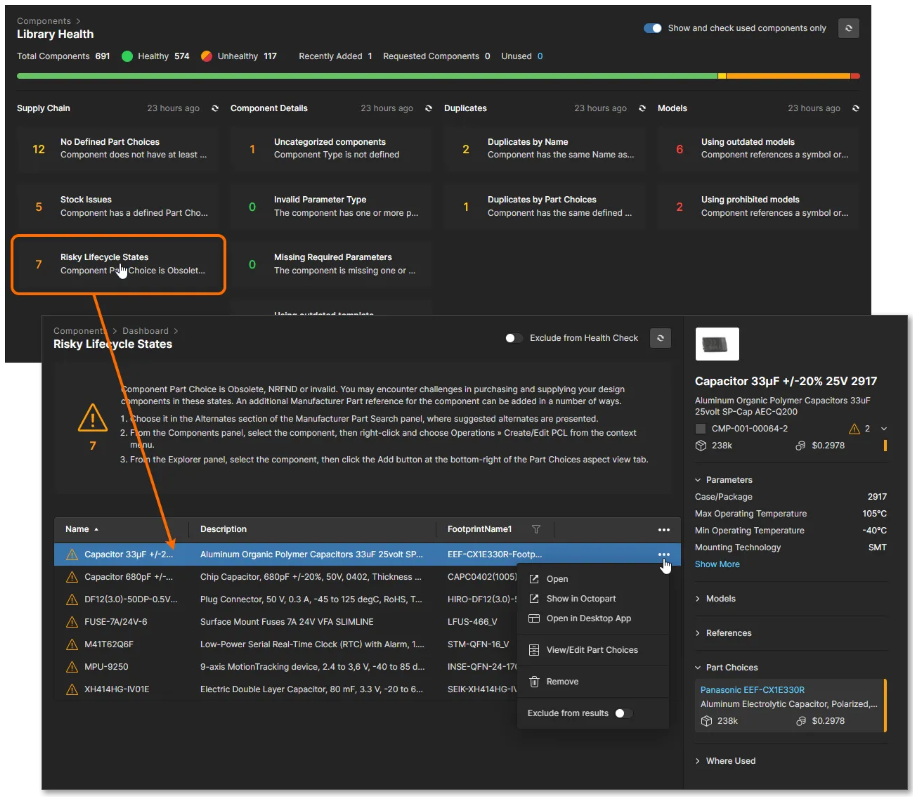
By default, the following columns of data are always presented:
- Name
- Description
- Revision ID
- FootprintName1
- Revision State
Click the ![]() control at the far right of the header region to access a window to enable the display of further columns of data.
control at the far right of the header region to access a window to enable the display of further columns of data.

Selecting a component entry will present detailed information on the right-hand pane.

You can quickly access the component's page within the "Octopart" site on a separate browser. Select the component of interest, click the control at its far right, then choose the "Show in Octopart" command from the associated menu. You also have the option to open a datasheet or delete the component.

The detailed Library Health dashboard page is the only place from which you can run another health check – refreshing the dashboard, as it were. This can be performed at two levels: refreshing the dashboard entirely or partially.
Refresh dashboard entirely – runs an update across all issue themes and associated health check analyses. This refresh level is performed by clicking the button at the top right of the main Library Health dashboard page. During the refresh, the button will change , and the text will appear next to each supported issue theme.

Refresh dashboard partially – runs an update across all associated health check analyses in a particular issue theme. This refresh level is performed from two places – by clicking the ![]() control next to the issue theme entry on the main Library Health dashboard page or by clicking the
control next to the issue theme entry on the main Library Health dashboard page or by clicking the ![]() button in the heading of the detailed page when inspecting one of the health check analysis types in that issue theme.
button in the heading of the detailed page when inspecting one of the health check analysis types in that issue theme.

To learn how to perform a Health Check in Altium Designer, please visit: Library Health Dashboard. 🎬Library Health