See What's Wrong
Once your BOM is created, BOM Portal runs automatic health checks. Issues are flagged in two places: the Dashboard for high-level metrics, and the Issues tab for detailed resolution.
Using the Dashboard Tab
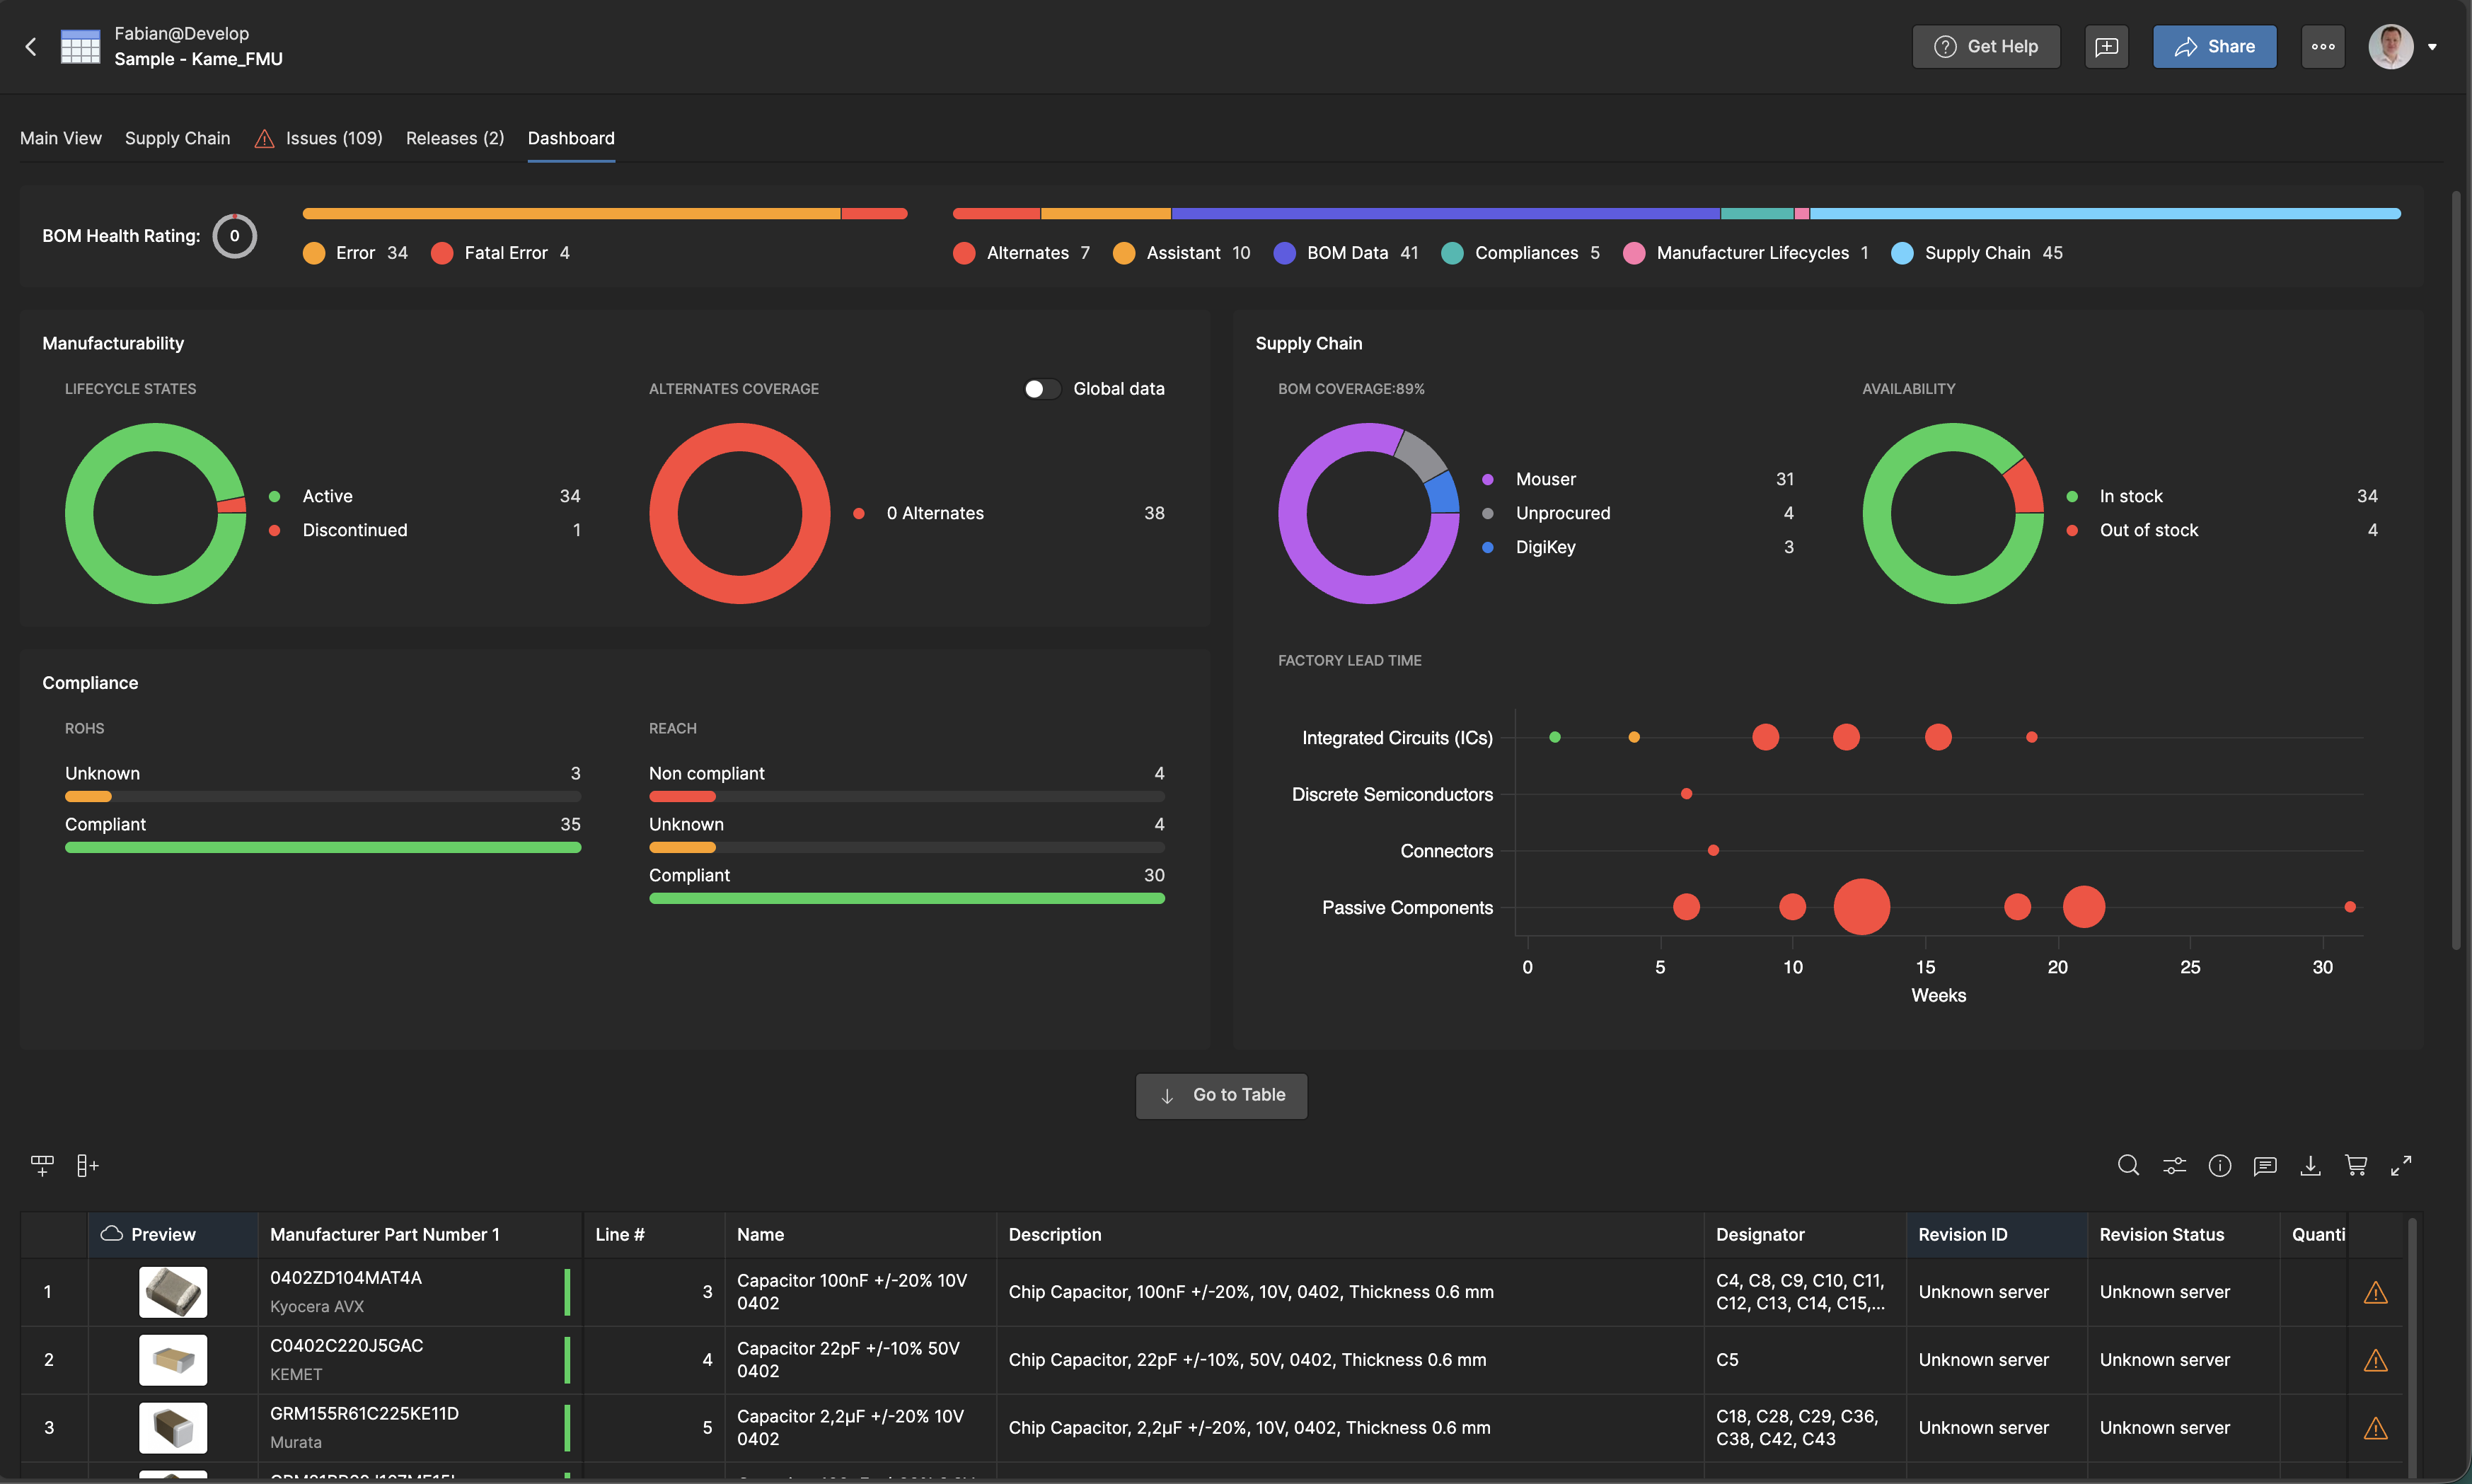
The Dashboard provides a great overview with visual indicators and quick filtering options. It shows your BOM health at a glance with color-coded metrics organized into three main sections: Manufacturability, Supply Chain, and Compliance.
BOM Health Rating: At the top, you'll see an overall health score (1-5) with a visual bar showing the breakdown of issues:
- Green (No Issues): Components with no detected problems
- Yellow (Warning): Components with minor issues that should be reviewed
- Orange/Red (Error): Components with critical problems that must be resolved
Manufacturability Section:
- Lifecycle States: Visual breakdown of component lifecycle status (Active, NRND, EOL, Obsolete)
- Alternates Coverage: Shows how many components have approved alternatives (0, 1, or 2+ alternates per component)
Supply Chain Section:
- BOM Coverage: Percentage of components with available supplier data
- Supplier Distribution: Pie chart showing which distributors have your components in stock (Mouser, Arrow Electronics, Newark, Avnet, Farnell, DigiKey, etc.)
- Availability: Quick view of how many components are in stock vs. out of stock
- Factory Lead Time: Scatter plot showing lead times by component category, helping you identify potential delays
Compliance Section:
- RoHS Compliance: Count of compliant, non-compliant, and unknown status components
- REACH Compliance: Breakdown of compliance status for REACH regulations
Using the Issues Tab
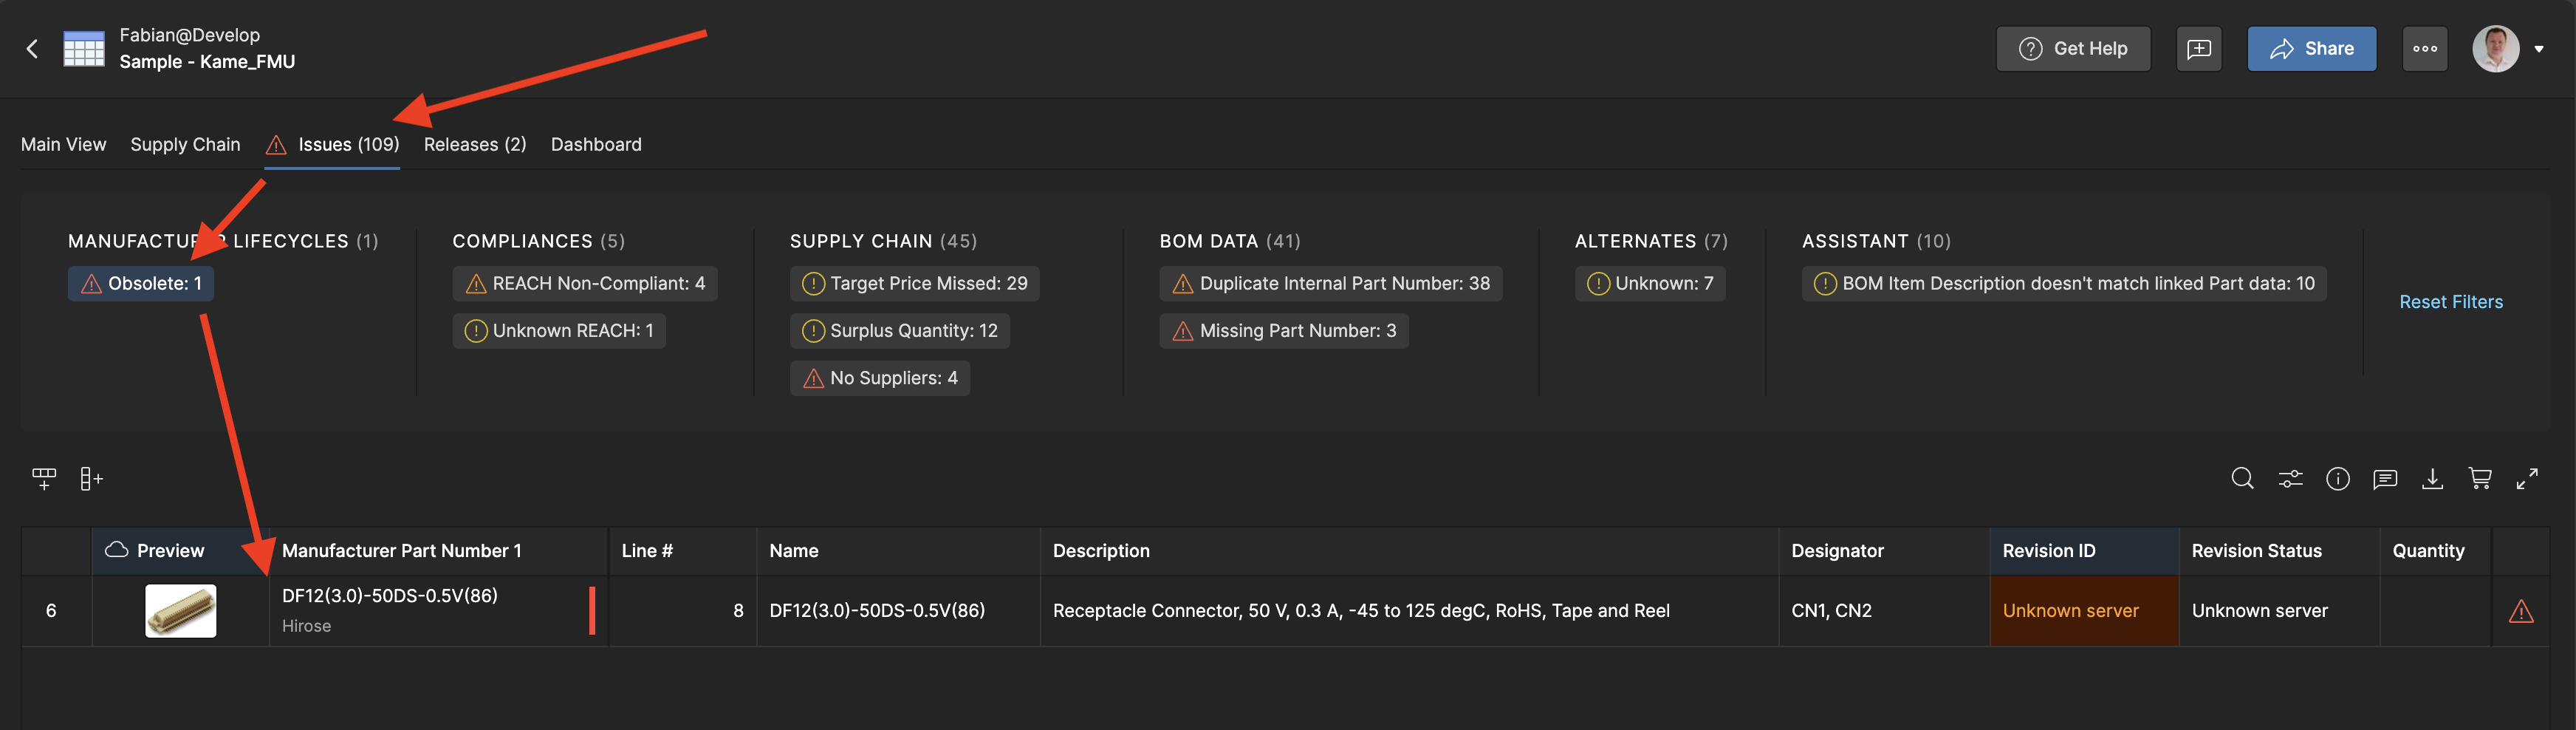
The Issues tab is your primary place for identifying and resolving BOM problems. It categorizes issues by type and provides filtering tools to focus on what matters most.
Open the Issues tab
Located next to Main View at the top of your Managed BOM. You'll see a dashboard summarizing Lifecycle, Compliance, and BOM Data issues.
Filter by issue type
Use the All Issues dropdown to view specific categories. For example, clicking "Missing Part Number: 6" shows only the 6 parts missing manufacturer part numbers.
Review each issue
Each row shows the affected part, issue severity, and description. Visual indicators (green check, yellow warning, red error) help prioritize what needs attention first.
Common Issue Types
- Missing Part Numbers: parts without manufacturer part numbers cannot be sourced. These must be resolved first.
- Lifecycle issues: parts marked as NRND (Not Recommended for New Designs), EOL (End of Life), or Obsolete
- Compliance violations: Parts that don't meet RoHS, REACH, or other regulatory requirements
- Stock availability: Parts with low or zero stock across distributors
- Unknown lifecycle: Parts where lifecycle status cannot be determined from integrated data sources
Where the Data Comes From
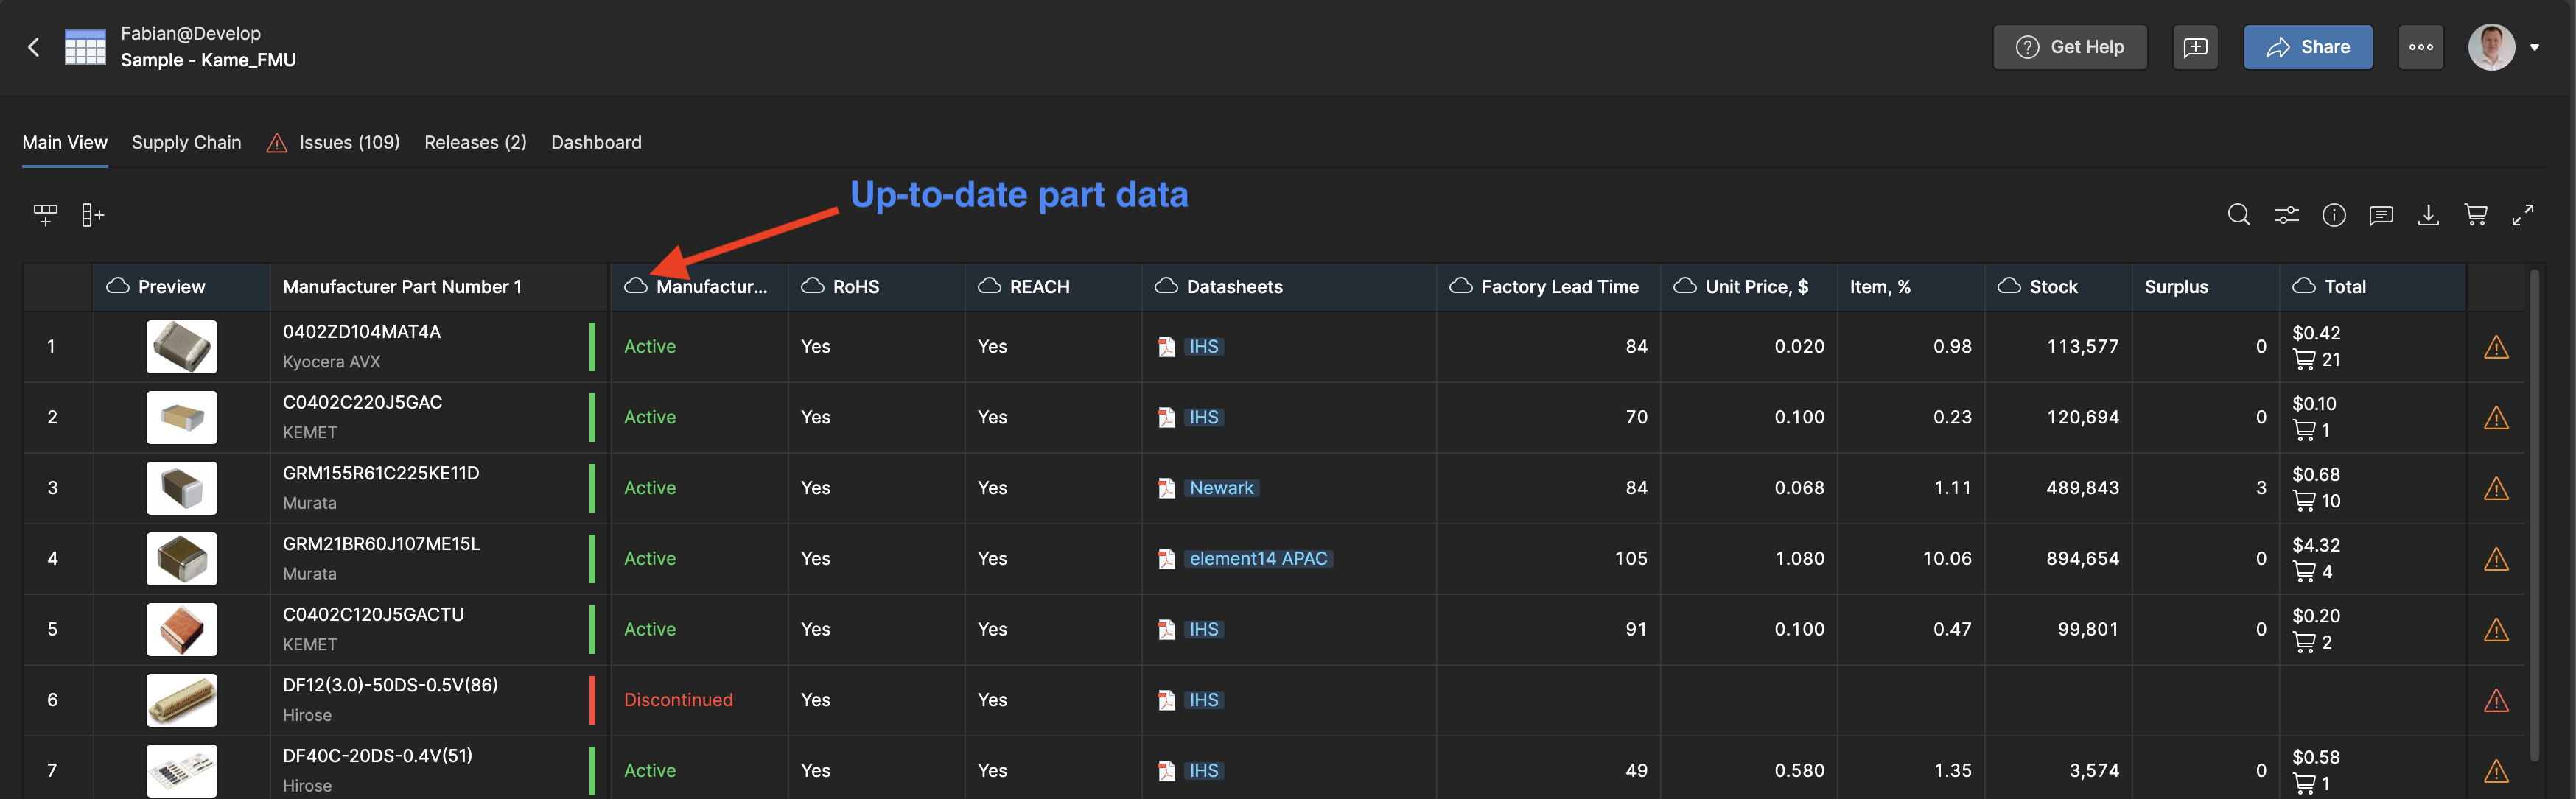
Understanding your data sources helps you interpret issues and know which information is most reliable. Those parameters are highlighted by a cloud icon next to the column name. This means this data isn’t static and will always be up-to-date.
Built-in Essential Part Intelligence
- Octopart (Altium Parts Provider): Distributor pricing, availability, stock levels, MOQ information, real-time pricing data
- Accuris (IHS Markit): Part datasheets, compliance documents (RoHS, REACH), lifecycle status, standards compliance data
Learn more about Essential Part Intelligence
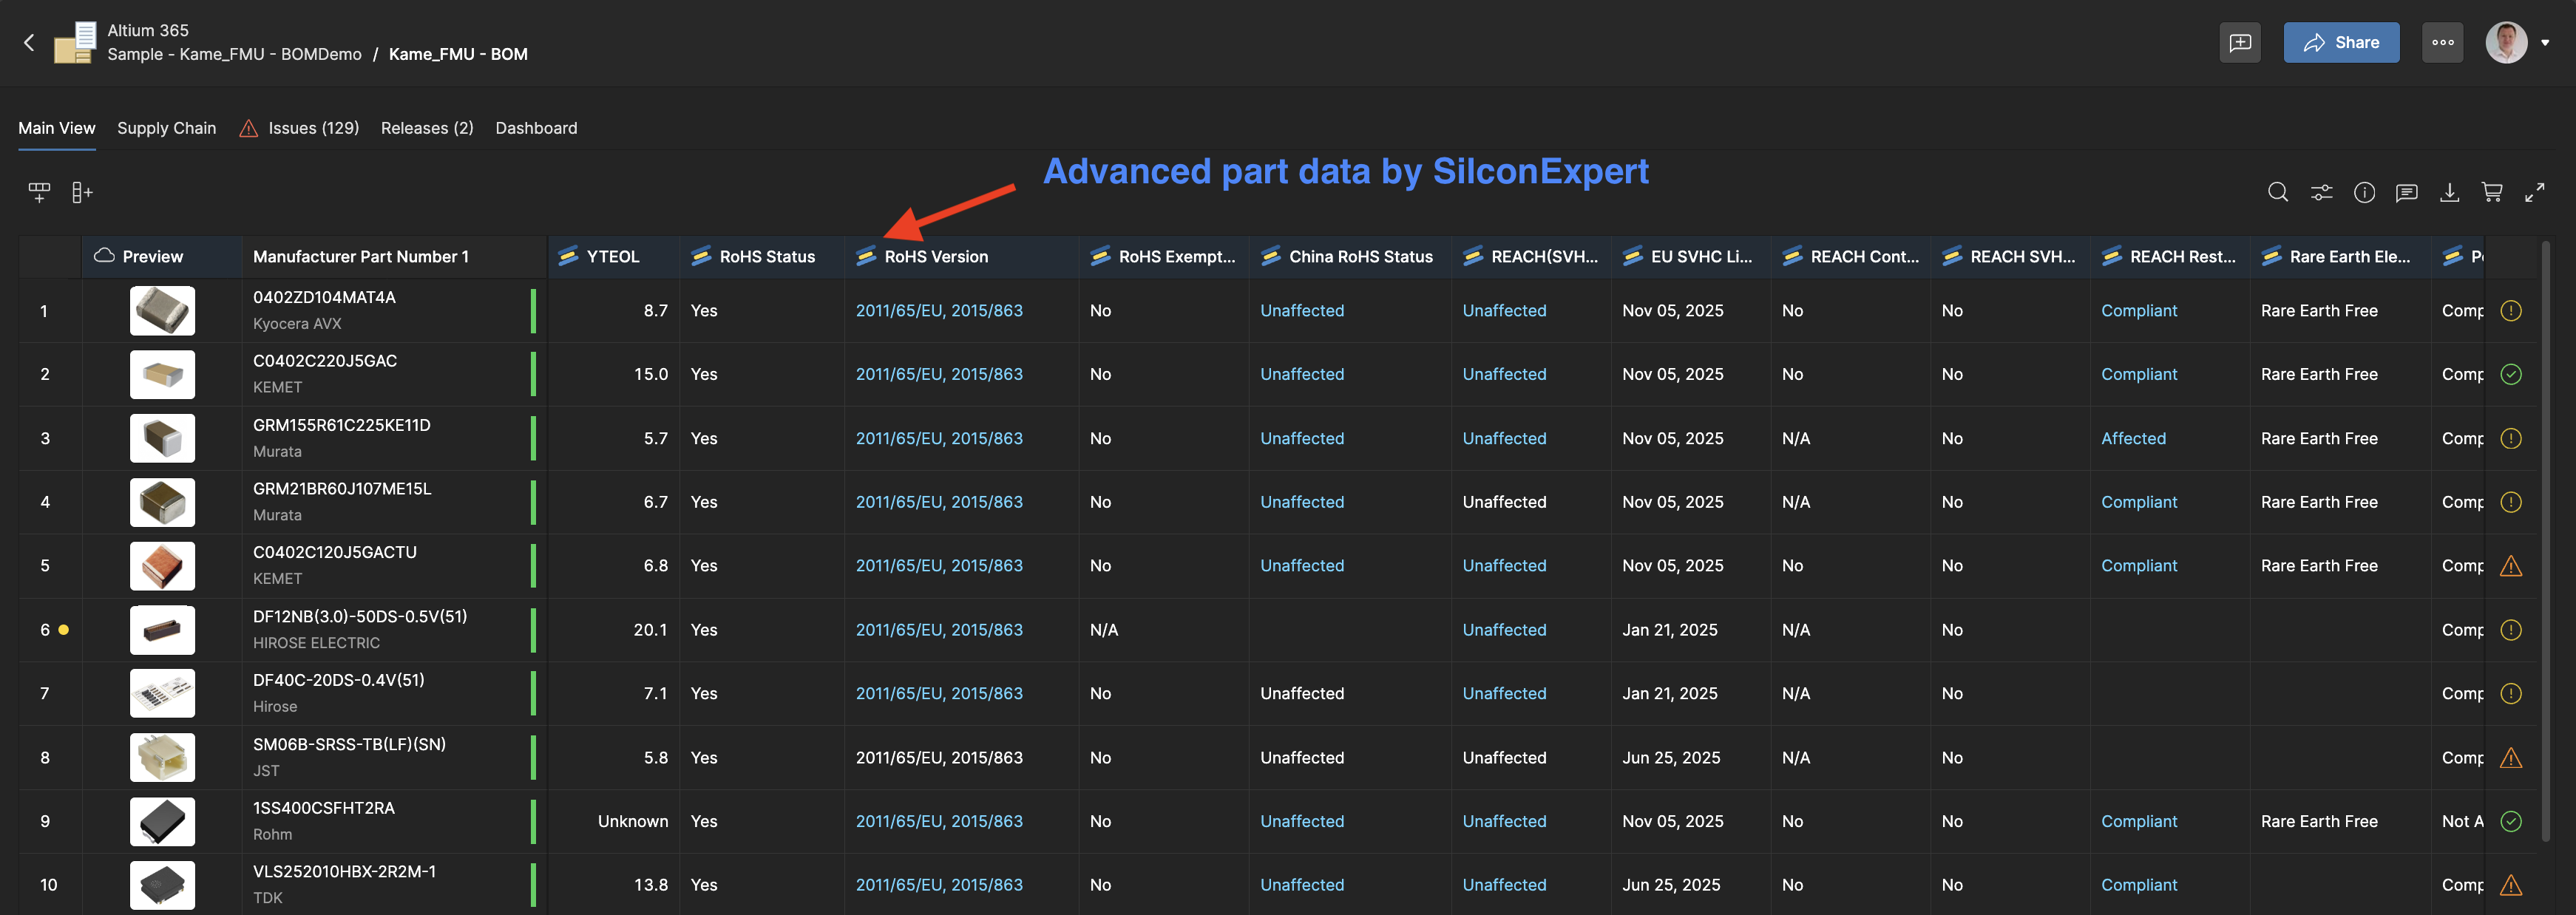
Optional Advanced Data Extensions
Those parameters are highlighted by a logo icon next to the column name. This means this data isn’t static and will be kept always up-to-date by the selected data extension.
Enable these in Workspace Extensions for advanced capabilities:
- SiliconExpert: YTEOL (Years To End Of Life) forecasting, Product Change Notices, form-fit-function alternatives, detailed compliance documentation
- Z2Data: Composite risk scoring (0-100), supply chain risk assessment, multi-factor compliance analysis, alternative part recommendations