See What's Wrong
Once your BOM is created, BOM Portal runs automatic health checks. Issues surface in two places: the Dashboard for high-level metrics, and the Issues tab for detailed resolution.
Using the Dashboard Tab
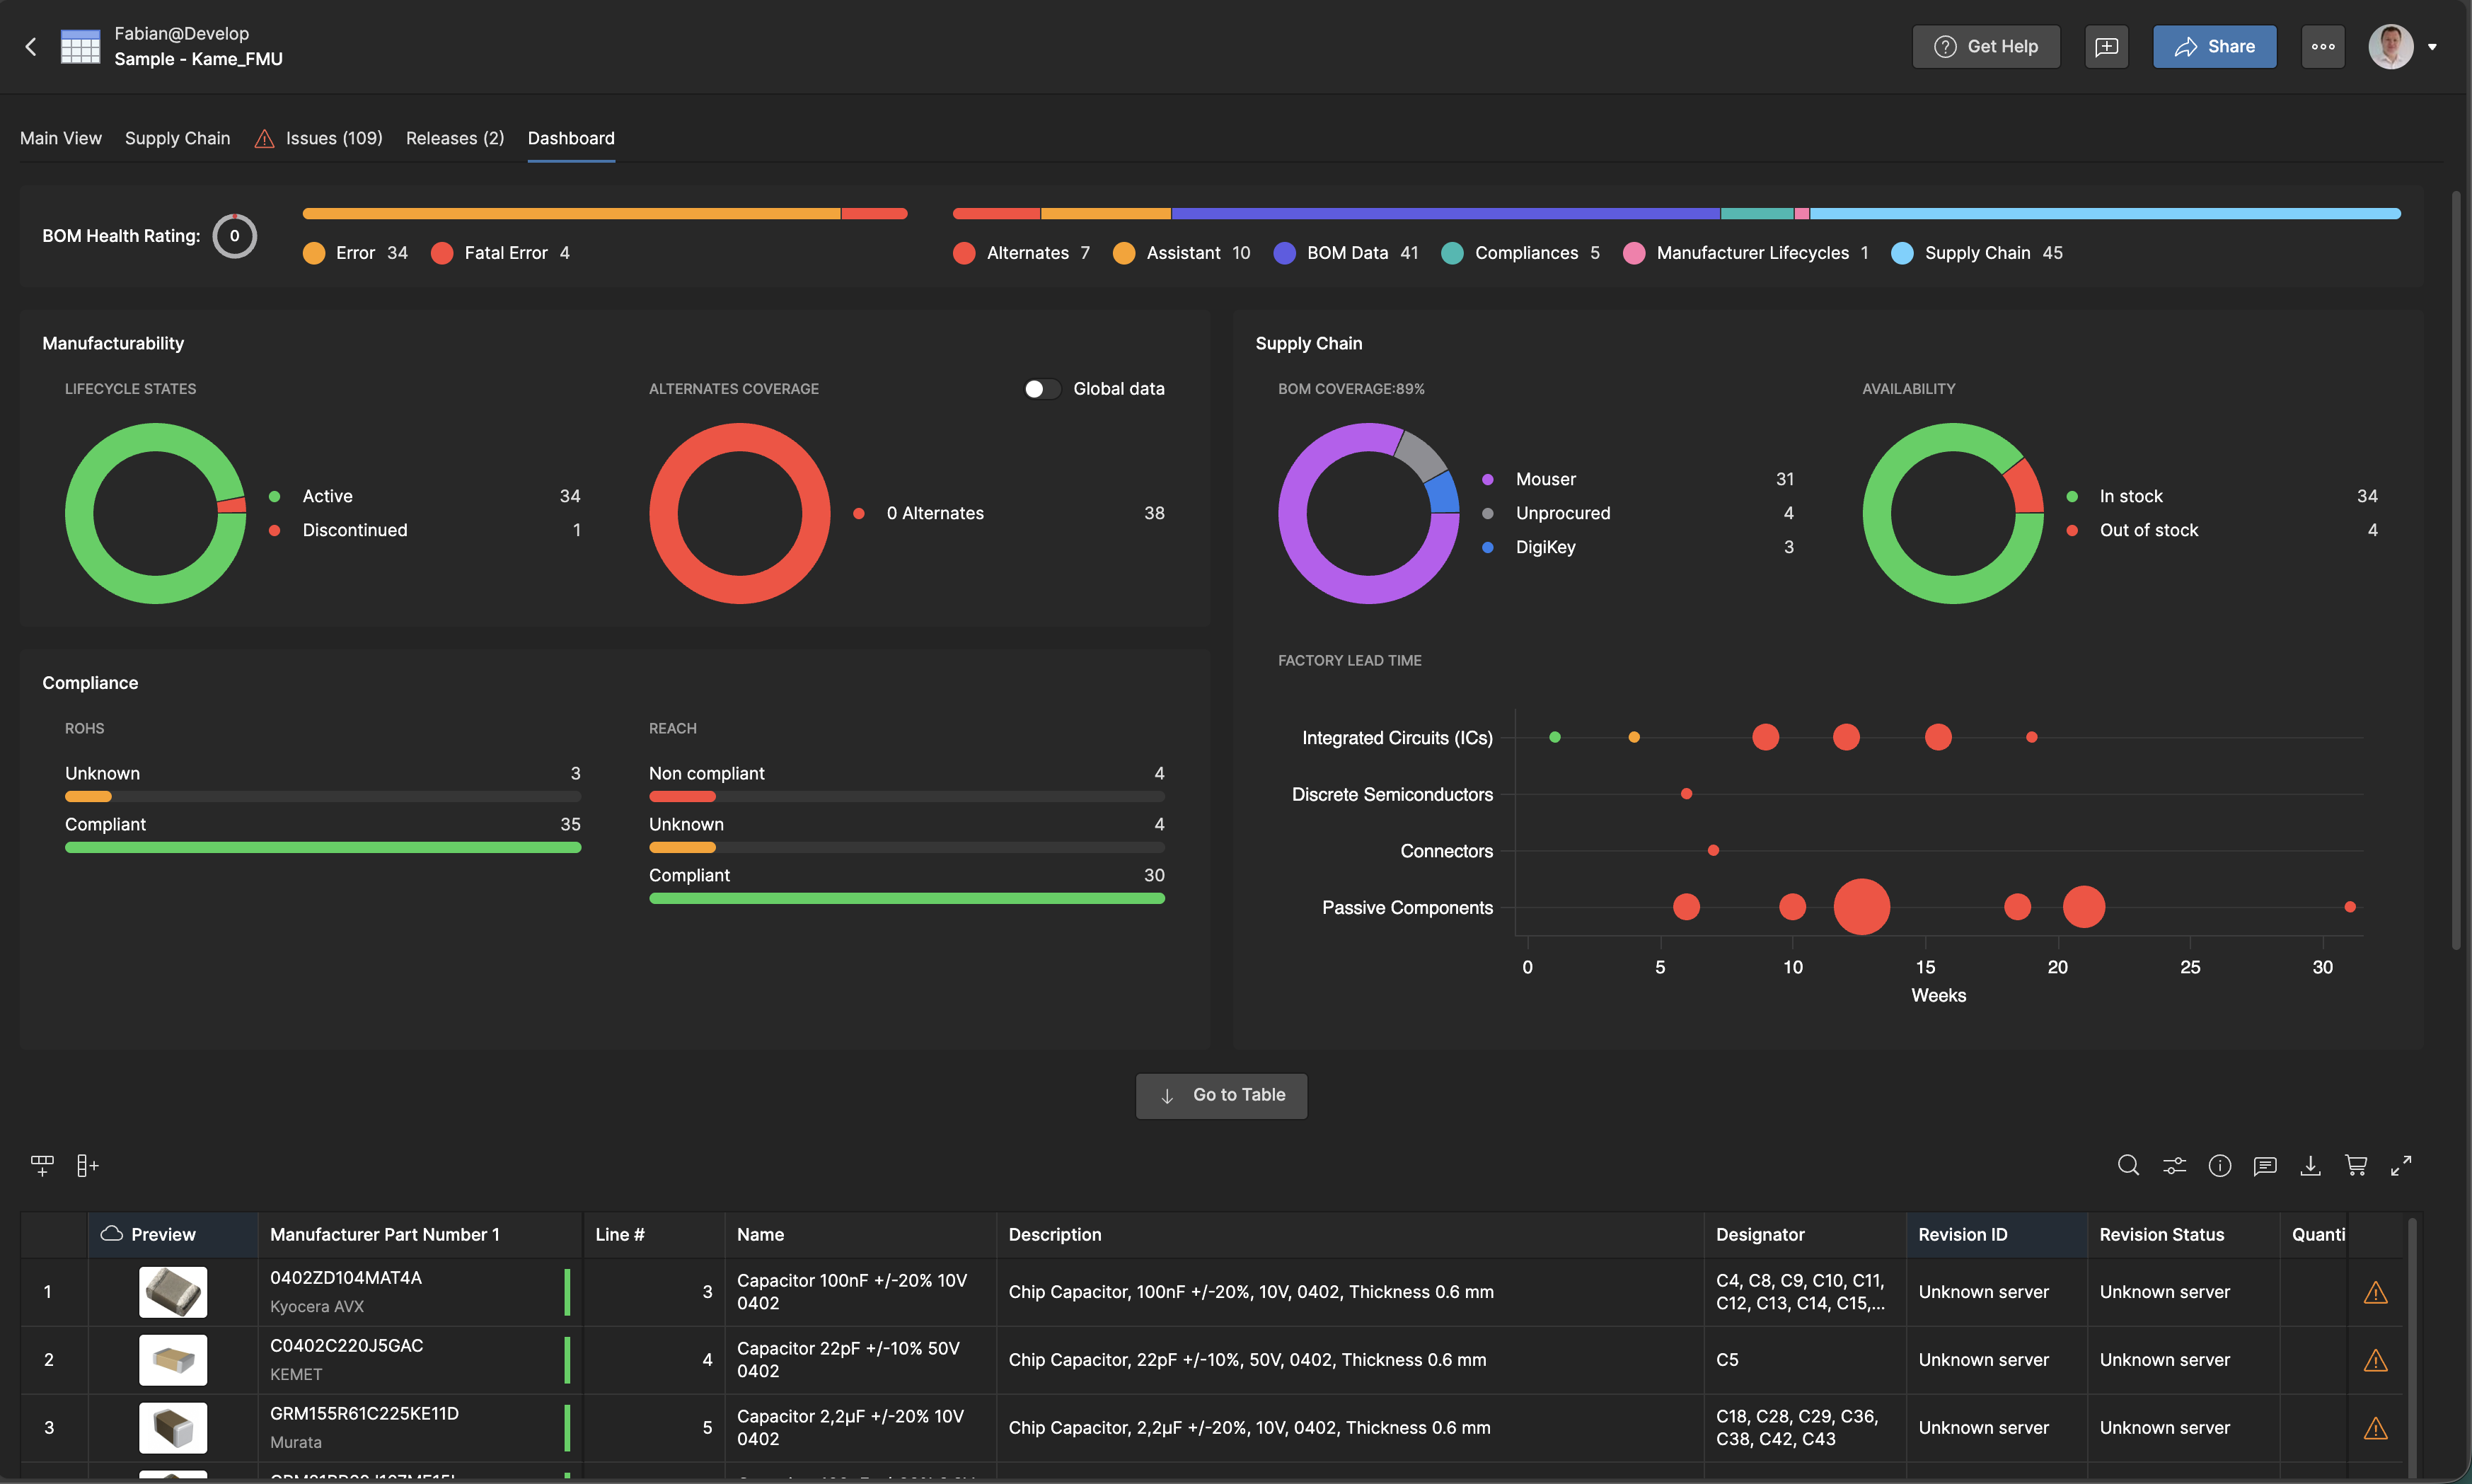
The Dashboard shows BOM health at a glance. At the top is an overall health rating (1-5) with a visual bar breaking down your components into green (no issues), yellow (warning, worth reviewing), and orange/red (error, must be resolved).
Below it, three sections give you the details:
- Manufacturability - lifecycle status across your components, and how many have approved alternates
- Supply Chain - coverage, distributor stock, availability, and factory lead times
- Compliance - RoHS and REACH status.
Using the Issues Tab
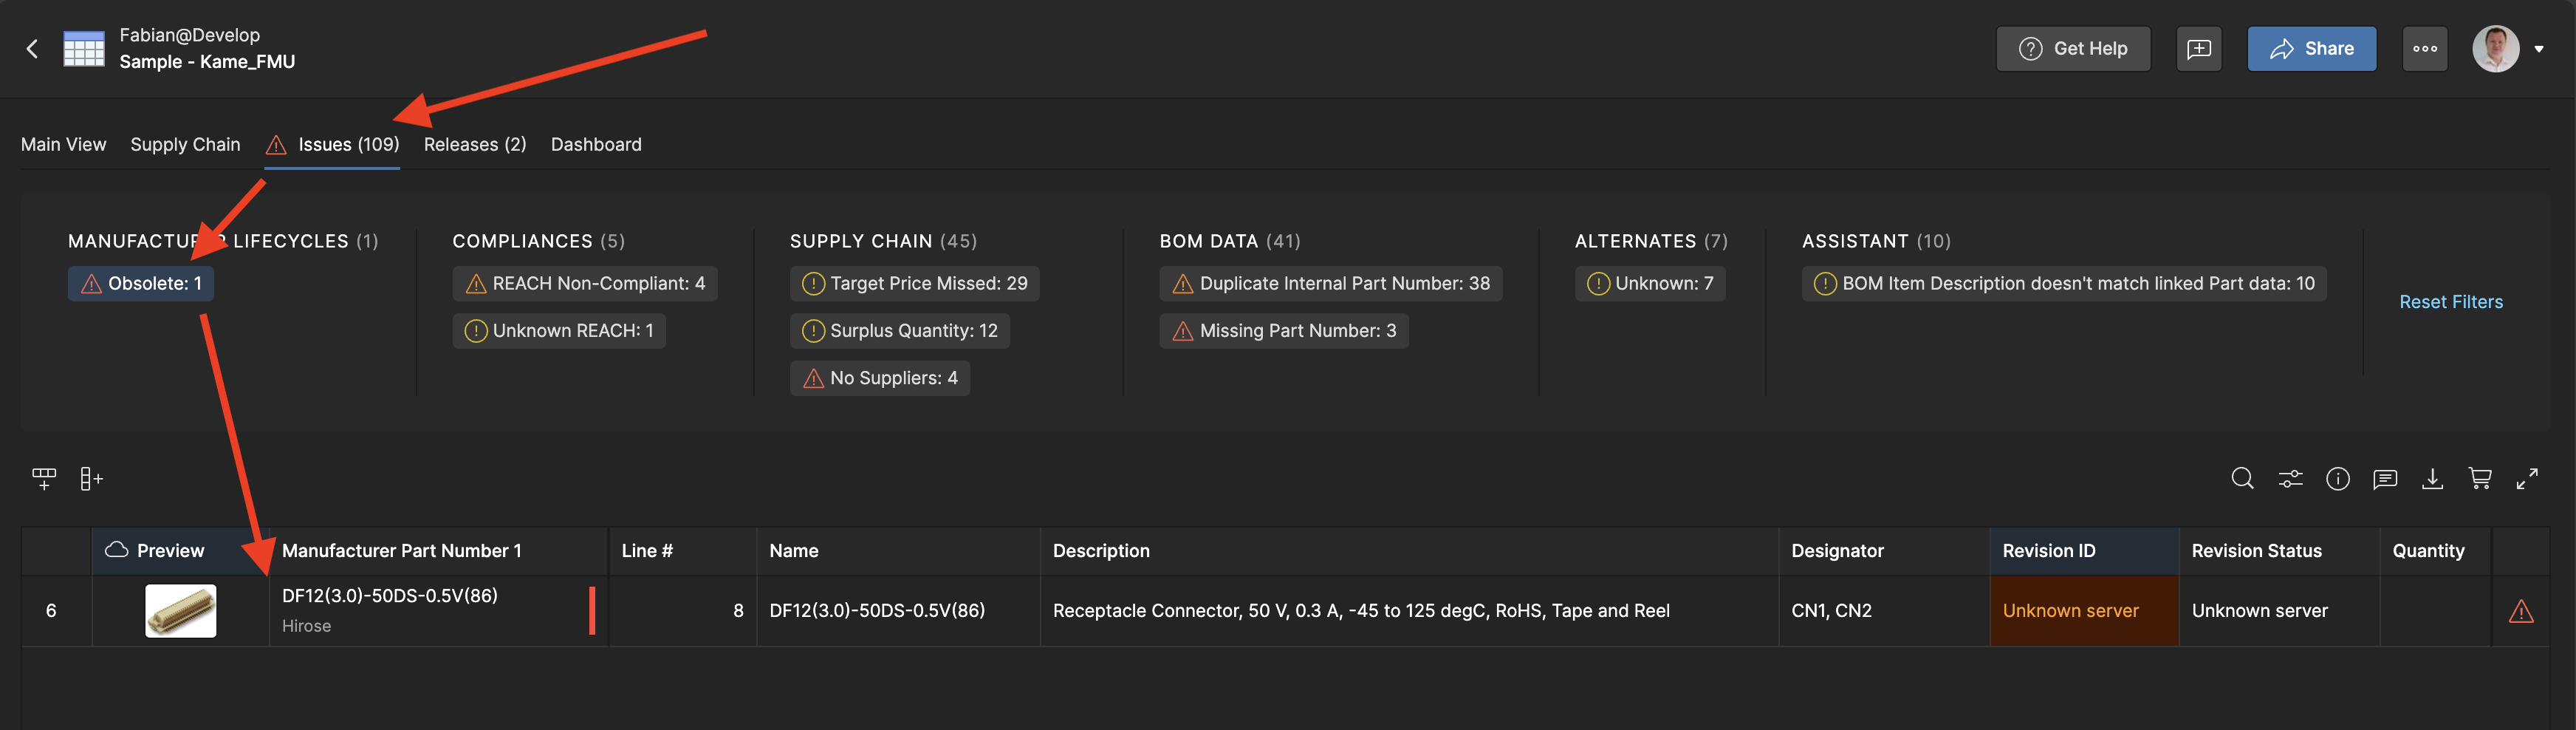
The Issues tab is where you identify and resolve problems. It categorizes issues by type and lets you filter down to what matters most.
1. Open the Issues tab. Located next to Main View at the top of your Managed BOM. You'll see a summary of Lifecycle, Compliance, and BOM Data issues.
2. Filter by issue type. Use the All Issues dropdown to view specific categories. Clicking "Missing Part Number: 6" shows only the 6 parts missing manufacturer part numbers.
3. Review each issue. Each row shows the affected part, issue severity, and description. Visual indicators help you prioritize what needs attention first.
Where the Data Comes From
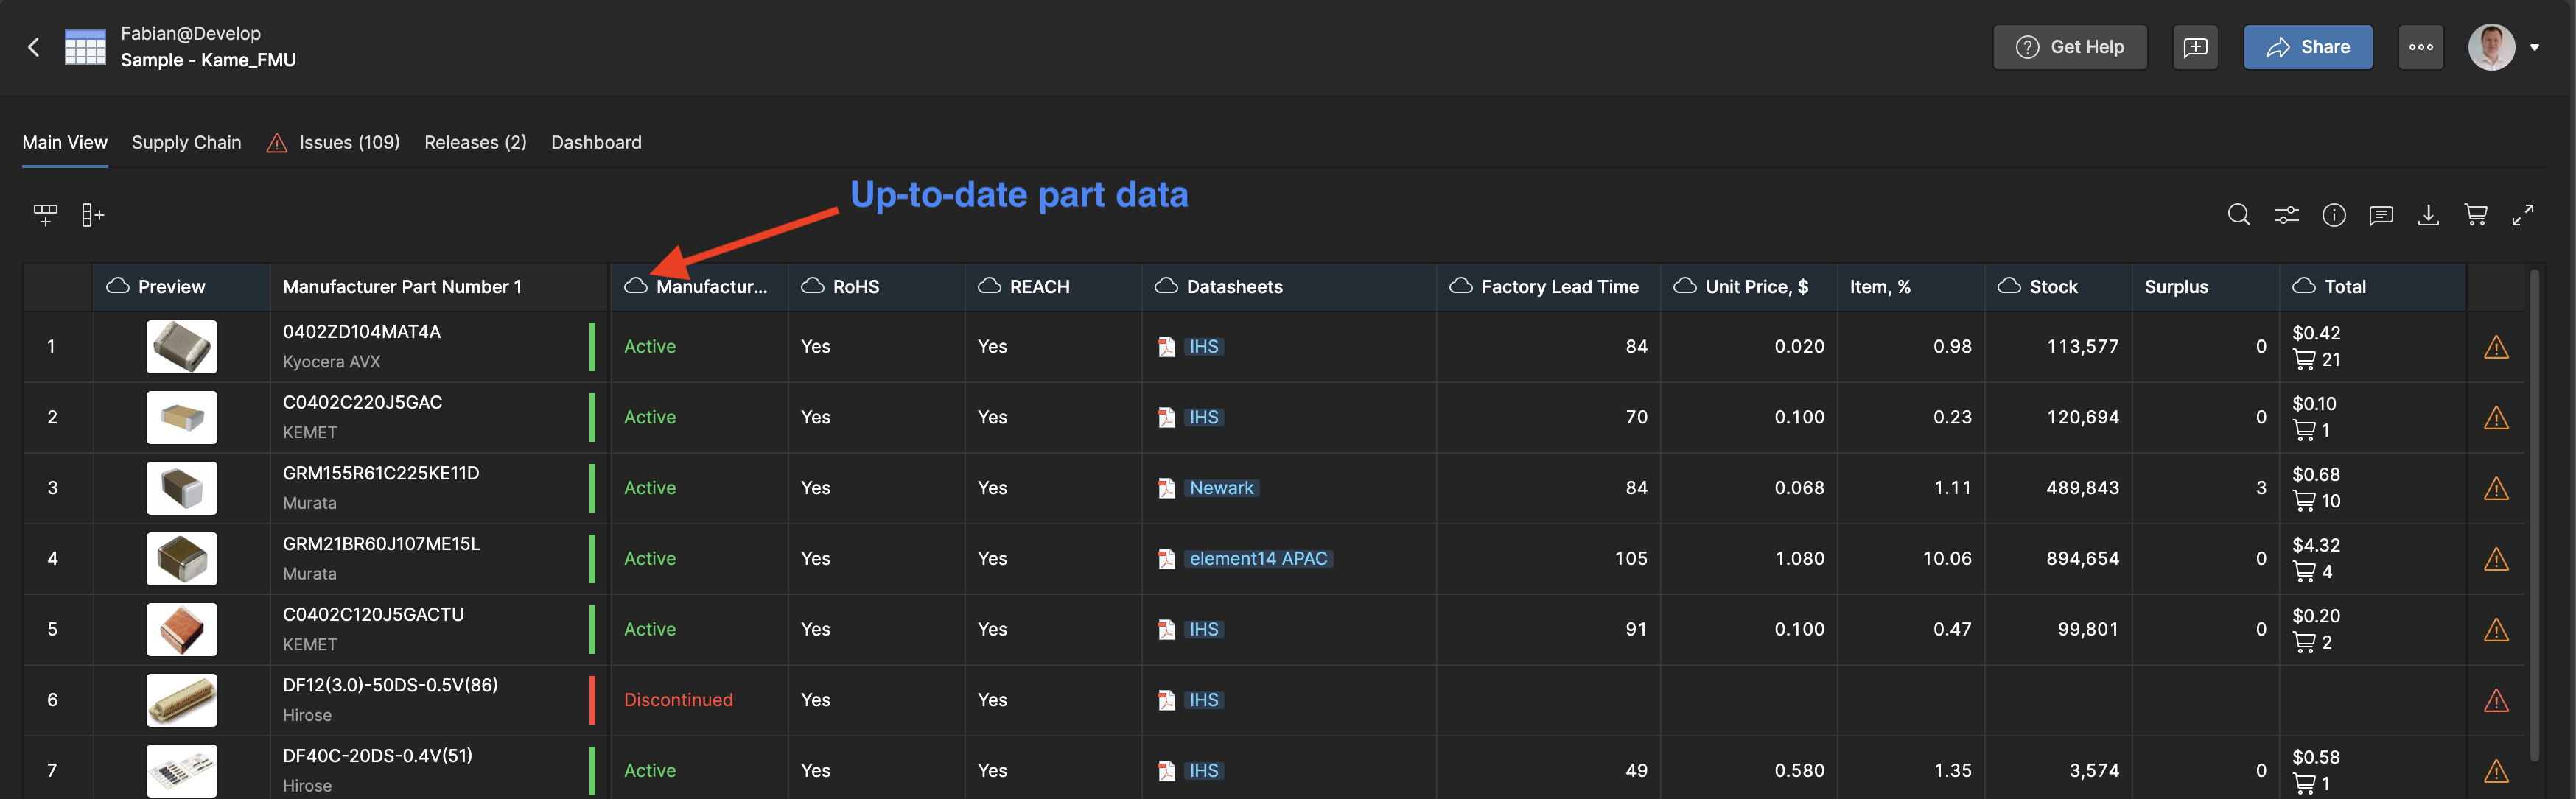
Live data is marked in the column header, so you always know what is static and what is kept up to date for you.
- A cloud icon means built-in Essential Part Intelligence: pricing, availability, stock and MOQ from Octopart, plus datasheets, compliance documents and lifecycle status from Accuris (IHS Markit). Learn more.
- A provider logo means an optional data extension: SiliconExpert adds YTEOL forecasting, Product Change Notices and form-fit-function alternatives; Z2Data adds composite risk scoring and supply chain risk assessment. Enable them under Admin → Extensions.